- Accelerator/Decelerator Oscillator
- Accumulation/Distribution
- Alligator
- Average Directional Movement Index
- Average True Range
- Awesome Oscillator
- Bears Power
- Bollinger Bands
- Bulls Power
- Commodity Channel Index
- DeMarker
- Envelopes
- Force Index
- Fractals
- Gator Oscillator
- Ichimoku Kinko Hyo
- Market Facilitation Index
- Momentum
- Money Flow Index
- Moving Average
- Moving Average Convergence/Divergence
- Moving Average of Oscillator
- On Balance Volume
- Parabolic SAR
- Relative Strength Index
- Relative Vigor Index
- Standard Deviation
- Stochastic Oscillator
- Williams' Percent Range
Technical Indicators
Technical indicator is a mathematical manipulation of a security price and/or volumes aimed at forecasting of future price changes. Decisions about how and when to open or close positions can be made on basis of signals from technical indicators. According to their functionalities, indicators can be divided into two groups: trend indicators and oscillators. Trend indicators help to assess the price direction and detect the turn moments synchronously or with a delay. Oscillators allow to find the turning moments ahead or synchronously.
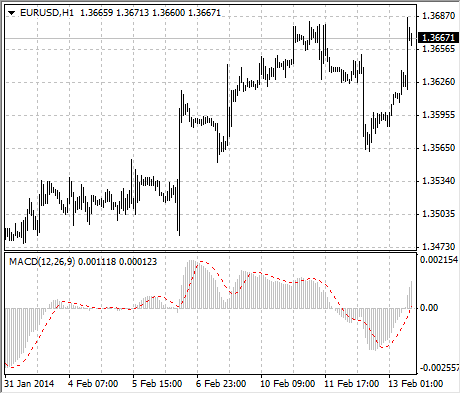
Indicators are imposed into the chart from the "Navigator" window by means of Drag`n`Drop technique, by execution of the "Insert – Indicators" menu command, or by pressing of the ![]() button of the "Charts" toolbar. A technical indicator can be drawn in a separate indicator window that has a specific vertical scale (for example, MACD)
button of the "Charts" toolbar. A technical indicator can be drawn in a separate indicator window that has a specific vertical scale (for example, MACD)
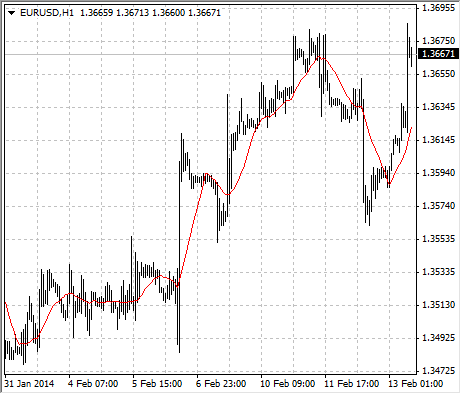
or it can be imposed directly into the price chart (for example, Moving Average).
At that, indicators can be drawn not only for price data and derivatives thereof (Median Price, Typical Price, Weighted Close), but also for other indicators. For example, Moving Average for Awesome Oscillator can be drawn, and a signal line can be obtained additionally to AO in this way. To do so, one has to draw AO indicator first, and then, using Drag`n`Drop technique, impose MA into AO and select "Previous Indicator Data" option in its settings in the "Apply to" option. If the "First Indicator Data" option is selected, MA will be drawn on basis of data of the very first imposed indicator that can be other than AO.
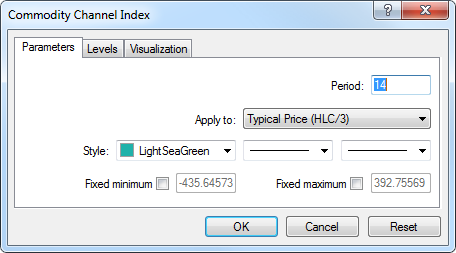
Besides analytical parameters, one can set colors for various elements, thickness of lines, and sizes of signs used, at setting up of the indicator. Moreover, the visualization mode of the object for different timeframes can be changed in the "Visualization" tab. At that, indicator will be shown on at timeframes that have been selected. This function can be useful if the tool has different settings for different timeframes. Using the "Show in the Data Window" option in the same tab, one can control over visualization of information about indicators in the "Data Window".
All settings can be changed. To do so, one has to select the desired indicator in the "Indicators List" window and press the "Edit" button or execute the "Properties..." command of the indicator context menu.
Indicator context menu can be called by clicking with the right mouse button on a line, sign, or diagram of the desired indicator. To remove an indicator, one has to execute the "Delete Indicator" indicator context menu command or the "Delete Indicator Window" command in the chart or indicator context menus. The "Delete Indicator Window" command closes the indicator window.
Attention: Having placed cursor near a line, a sign, or a column border of an indicator histogram, one can determine precise value of this given indicator in this point. |