- Accelerator/Decelerator Oscillator
- Accumulation/Distribution
- Alligator
- Average Directional Movement Index
- Average True Range
- Awesome Oscillator
- Bears Power
- Bollinger Bands
- Bulls Power
- Commodity Channel Index
- DeMarker
- Envelopes
- Force Index
- Fractals
- Gator Oscillator
- Ichimoku Kinko Hyo
- Market Facilitation Index
- Momentum
- Money Flow Index
- Moving Average
- Moving Average Convergence/Divergence
- Moving Average of Oscillator
- On Balance Volume
- Parabolic SAR
- Relative Strength Index
- Relative Vigor Index
- Standard Deviation
- Stochastic Oscillator
- Williams' Percent Range
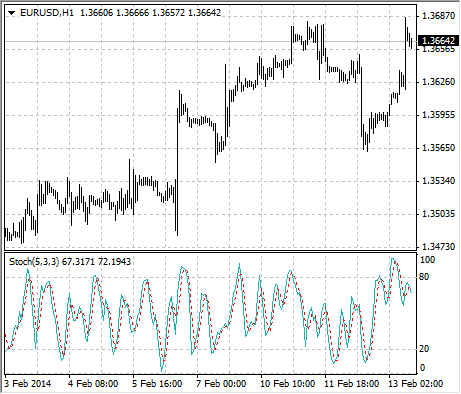
Stochastic Oscillator
The Stochastic Oscillator Technical Indicator compares where a securitys price closed relative to its price range over a given time period. The Stochastic Oscillator is displayed as two lines. The main line is called %K. The second line, called %D, is a Moving Average of %K. The %K line is usually displayed as a solid line and the %D line is usually displayed as a dotted line.
There are several ways to interpret a Stochastic Oscillator. Three popular methods include:
- Buy when the Oscillator (either %K or %D) falls below a specific level (for example, 20) and then rises above that level. Sell when the Oscillator rises above a specific level (for example, 80) and then falls below that level;
- Buy when the %K line rises above the %D line and sell when the %K line falls below the %D line;
- Look for divergences. For instance: where prices are making a series of new highs and the Stochastic Oscillator is failing to surpass its previous highs.
Calculation
The Stochastic Oscillator has four variables:
- %K periods. This is the number of time periods used in the stochastic calculation;
- %K Slowing Periods. This value controls the internal smoothing of %K. A value of 1 is considered a fast stochastic; a value of 3 is considered a slow stochastic;
- %D periods. his is the number of time periods used when calculating a moving average of %K;
- %D method. The method (i.e., Exponential, Simple, Smoothed, or Weighted) that is used to calculate %D.
The formula for %K is: %K = (CLOSE-LOW(%K))/(HIGH(%K)-LOW(%K))*100
Where:
CLOSE – is todays closing price;
LOW(%K) – is the lowest low in %K periods;
HIGH(%K) – is the highest high in %K periods.
The %D moving average is calculated according to the formula: %D = SMA(%K, N)
Where:
N – is the smoothing period;
SMA – is the Simple Moving Average.