- Setup
- Results
- History Files in FXT Format
Results
After the testing has been completed, one can see the results thereof in the tabs of "Results", "Graph", "Report", and "Journal".
Results
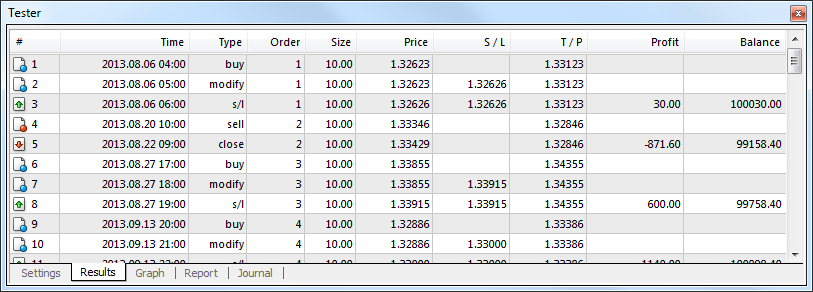
Information about all trade operations performed is given in this tab as a table:
- # – the trade operation sequence number;
- Time – time at which the operation was performed;
- Type – type of the operation (sell, buy, s/l, t/p, modify, close at stop, etc.);
- Order – ticket number of trade position or pending order (not to be mixed up with the trade operation sequence number described above);
- Size – amount of lots traded;
- Price – symbol price during operation;
- S/L – the Stop Loss order value. No entries in this field mean that the order was not placed;
- T/P – the Take Profit order value. No entries in this field mean that the order was not placed;
- Profit – profit/loss. The profit/loss value is entered only at closing of positions;
- Balance – balance value. The balance value is recorded only at closing of positions.
Having clicked with the left mouse button on any column header, onl can sort out all entries in the table in increasing or decreasing order. Using the "Copy" context menu command or accelerating keys of Ctrl+C, one can copy the selected lines of results to the clipboard for further use in other applications. If no line has been selected, the entire table will be copied to the clipboard. As well, to copy the entire table to the clipboard, one can execute the "Copy All" command. The report of results can be saved in the hard disk as an HTML file. To do so, one has to execute the "Save as Report" context menu command. The commands of "Set Date "From"" and "Set Date "To"" allow to set the time span for testing. At that, the selected operations dates will be written in the fields of "Use date from:" and "Use date to:" in the testing settings. This can be useful if there is a need to test an expert closely or to optimize its parameters within this range of dates.
Graph
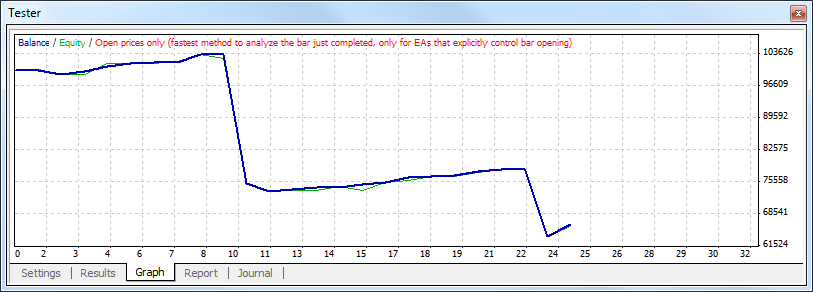
The graph representing the account balance (the blue line is "Balance") and general account status considering open positions (the green line is "Lots") is drawn in the "Graph" tab automatically. If only balance line is displayed in the graph, it means that the lines of "Balance" and "Lots" coincide during the entire testing period. Graph allows changes in trading results during testing even more visualized. If lot sizes were changed during testing, the chart of lot size changes will be shown in the bottom of the graph.
A double click with the left mouse button on any point in the graph will switch to the "Results" button, the corresponding line being selected. Using the "Copy" context menu command or accelerating keys of Ctrl+C, one can copy the graph to the clipboard to be used in other applications. A graph can also be saved in the hard disk as a GIF file. To do so, one has to execute the "Save as Picture" context menu command or press the accelerating keys of Ctrl+S. The commands of "Set Date "From"" and "Set Date "To"" allow to set the time span for testing. At that, the selected operations dates will be written in the fields of "Use date from:" and "Use date to:" in the testing settings. This can be useful if there is a need to test an expert closely or to optimize its parameters within this range of dates.
Report
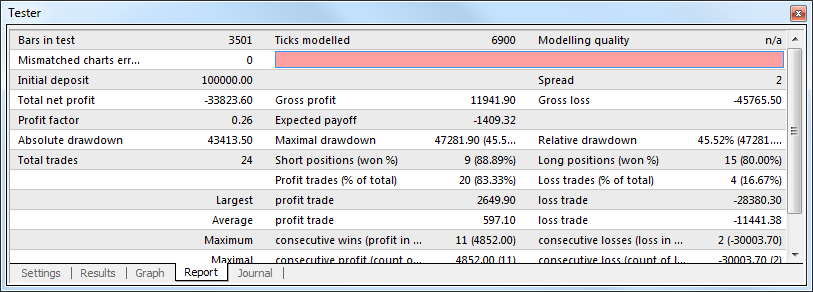
Generalized results of the expert testing and some key data are represented in the "Report" tab. Such reports allow to quickly compare various experts to each other. The following data are published in reports:
- Bars in test – the amount of history data modeled in bars;
- Ticks modeled – the amount of ticks modeled;
- Modeling quality – the quality of ticks modeled during testing, in per cents. Modeling is shown elementarily as a band in the next line of the report. The band can be of one of three colors:
- Gray – this part of available data was not involved into testing. Gray color can appear if there was a date range specified in the testing settings;
- Red – modeling was not performed in this space because of missing available data of a less timeframe. At that, only data of the timeframe selected in the testing settings were used;
- Green – modeling was performed in this space. And the brighter is the color, the higher modeling quality was. For example, at testing on the H1 period, the deep-green band means that data of M30 period were used for testing, and the brightest one does that M1 data were used;
Attention: If the fastest method ("Open prices only") was selected in the testing settings, the entire band will be red. At that, "n/a" (no modeling was performed) will be written in the "Modeling quality" field; |
- Initial deposit – the amount of initial deposit;
- Total net profit – financial result of all trades. This parameter represents the difference between "Gross profit" and "Gross loss";
- Gross profit – the sum of all profitable trades in monetary units;
- Gross loss – the sum of all unprofitable trades in monetary units;
- Profit factor – the ratio between the gross profit and the gross loss in per cents. One means that these sums are equal;
- Expected payoff – mathematical expectation of win. This parameter to be calculated statistically represents average profit/loss factor of one trade. It can also be considered as showing the expected profitability/unprofitability of the next trade;
- Absolute drawdown – the largest loss is below initial deposit value;
- Maximal drawdown – the largest loss of the local maximum in the deposit currency and in per cents of the deposit;
- Relative drawdown – the maximal loss in percents of the maximum equity value and its corresponding money value;
- Total trades – total amount of trade positions;
- Short positions (won %) – amount of short positions and the profit percentage thereof;
- Long positions (won %) – amount of long positions and the profit percentage thereof;
- Profit trades (% of total) – the amount of profitable trade positions and their part in the total trades, in per cents;
- Loss trades (% of total) – the amount of unprofitable trade positions and their part in the total trades, in per cents;
- Largest profit trade – the largest profit among all profitable positions;
- Largest loss trade – the largest loss among all unprofitable positions;
- Average profit trade – average profit value within a trade (sum of profits divided into the amount of profitable trades);
- Average loss trade – average loss value within a trade (sum of losses divided into the amount of unprofitable trades);
- Maximum consecutive wins (profit in money) – the longest series of profitable trade positions and sum of their wins;
- Maximum consecutive losses (loss in money) – the longest series of unprofitable trade positions and sum of their losses;
- Maximal consecutive profit (count of wins) – the maximal profit within one series of profitable trades and the corresponding amount of profitable trades;
- Maximal consecutive loss (count of losses) – the maximal loss within one series of unprofitable trades and the corresponding amount of unprofitable trades;
- Average consecutive wins – average amount of profitable positions in consecutive profitable series;
- Average consecutive loss – average amount of unprofitable positions in consecutive unprofitable series.
The report can be copied to the clipboard or saved in the hard disk as an HTML file. To do so, one has to execute the context menu commands of "Copy" and "Copy as Report", respectively. The report can also be copied to the clipboard by pressing of accelerating keys of Ctrl+C.
"Journal" Tab
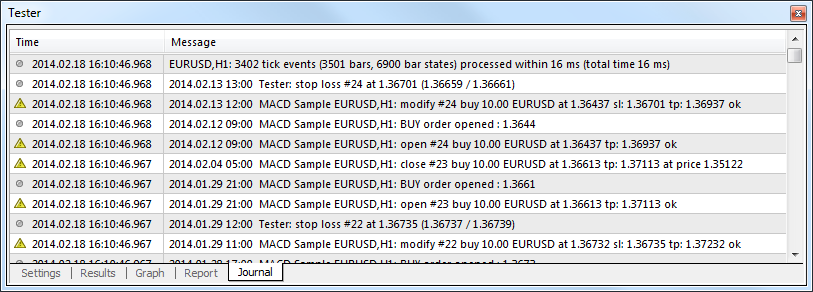
Information about testing process with all trade operations is automatically published in the "Journal" tab. This journal is the same as that of the "Terminal – Experts" window, except for that messages published in the tester window inform about testing the expert, but not about its operation at the market. After testing has been completed, these data will be output in a separate directory named /TESTER/LOGS. The testing journal files are stored in the /EXPERTS/LOGS directory, file names corresponding with the data of journal – YYYYMMDD.LOG.
The following commands can be execute from the context menu of this tab:
 Open – open the folder with the log files of the journal. Besides that, when this command is executed, all current journal records are saved to log files. These files are stored in the /TESTER/LOGS directory of the client terminal. File names correspond to the date when the journal was formed – YYYYMMDD.LOG. thus you can view previous records of the terminal operation. Only latest entries are displayed on the "Journal" tab;
 Copy – Copy the line with the information to clipboard for further using it in other applications;
- Clear All Journals Logs – delete all the log files of the strategy tester (/TESTER/LOGS). The Journal tab is cleared and all the log files are deleted from the specified folders when this commands is executed.
 Viewer – Open the window of the special program for viewing log files;
- Auto Scroll – if this option is enabled, the list of entries will be automatically scrolled to the latest entry as a new message appears in the journal.
- Auto Arrange – if this option is enabled, size of the table columns will be selected automatically when the window size is changed;
- Grid – show/hide grid to separate fields.