- Setup
- Results
Setup
Optimization represents consecutive passes of the same expert with different inputs on the same data. At that, such parameters can be taken that make the expert efficiency maximal. The terminal possesses in-built means that allow to automate this process. Before beginning to optimize expert parameters, one has to set them up. It means that one has to:
- select an expert and its inputs
- select a symbol and its timeframe
- select one of three bar modeling methods
- set up the time span for optimization (optional)
A special window named "Tester" is used for testing and optimization of experts in the terminal. All settings listed above can be made in the "Settings" tab of this window.
Expert Advisor and Its Parameters #
One has to select expert the parameters of which should be optimized in the "Tester – Experts" window. Not any expert file can be selected in this field, but only those that are available in the client terminal. For this, they must be compiled and placed in the /EXPERTS folder.
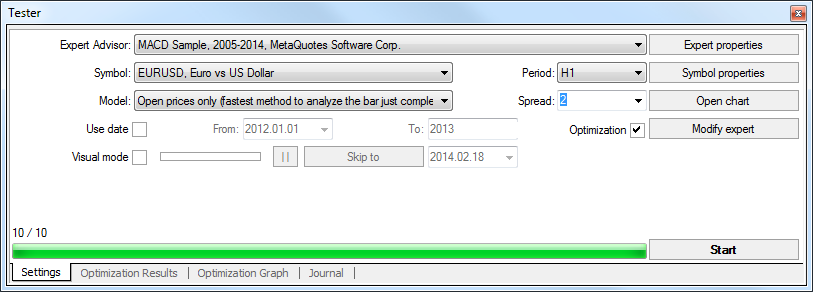
After the expert has been selected, one has to make an additional setup and set the inputs. This can be done by pressing of the "Expert properties" button.
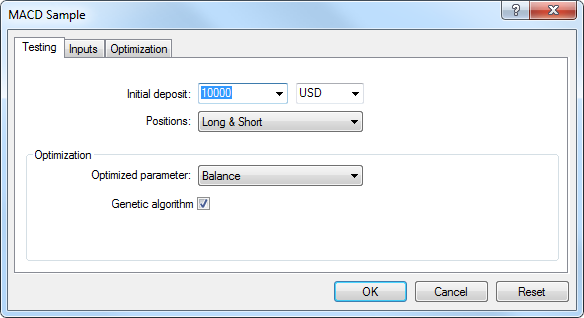
At that, a new window containing the following three tabs will appear:
Testing
General optimization parameters are set in this tab. They include the initial deposit volume and currency to be specified in the corresponding fields. It is this deposit that will be operated by the expert during optimization.
Types of positions to be opened are selected in this tab, as well: Only Long, Only Short, or Long and Short. Whatever expert algorithm is used, it will open positions only in the directions defined here.
One can turn on the genetic algorithm of optimization here. Detailed information about it is available in "Genetic algorithms: Mathematics" article.
An optimized parameter is a certain factor, whose value defines the quality of a tested set of parameters. The higher the value of the optimization criterion is, the better the testing result with the given set of parameters is considered to be. The following parameter are available for optimization:
- Balance – the highest value of the balance;
- Profit Factor – the highest value of the profit factor;
- Expected Payoff – the highest value of the expected payoff;
- Maximal Drawdown – the lowest value of the maximal drawdown;
- Drawdown Percent – the lowest value of the relative drawdown (in percentage terms);
- Custom – the optimization criterion here is the value of the OnTester() function in the Expert Advisor. This parameter allows using any custom value for the optimization of the Expert Advisor.
Inputs
All inputs are listed here as a table. Inputs are variables that influence the expert operation and can be changed directly from the client terminal. For these parameters to be changed, there is no need to change the expert code. The amount of inputs can vary depending of experts.
At optimization, the expert inputs are set in the fields of "Start", "Step", and "Stop". Initial values, change interval, and final values of external variables will be set in these fields, respectively. There are checkboxes to the left of variable names that include the parameter into optimization process. If a variable is not checked in this checkbox, it will not be involved into optimization. Its value will not be changed within the optimization process, and the parameter given in the "Value" field will be written here. The amount of expert passes depends on these parameters directly. Data written in the "Value" field do not influence the expert optimization and are necessary only for its testing.
The set of inputs already saved before (including those given in the fields of "Start", "Step", and "Stop") can be downloaded. This can be done by pressing of the "Load" button and having selected the preliminarily saved set of parameters. The current set of external variables can be saved by pressing of the corresponding button.
Optmization
Optimization – this tab allows to manage limitations during optimization. If any of conditions is met during a separate pass, this pass of the expert will be interrupted. Optimization will continue with the next pass.
To enable a limit in condition, one has to flag it in the checkbox to the left of it. Double click with the left mouse button in the "Value" field can be used to change the existing parameter; after typing new value, press "Enter". Limiting parameters are:
- Balance minimum – the smallest balance value in the deposit currency;
- Profit maximum – the largest profit in the deposit currency;
- Minimal margin level % – the lowest margin level in per cents;
- Maximal drawdown % – the largest drawdown in per cents;
- Consecutive loss – the largest loss within a series. Loss series is a number of consecutive loss trades;
- Consecutive loss trades – the largest amount of loss trades within a series;
- Consecutive win – the largest total profit within a series. Profitable series is a number of consecutive profitable trades;
- Consecutive win trades – the largest amount of profitable trades within a series.
Symbol and Its Period #
It is not enough just to select an expert and set it up to start optimization: a symbol and its period (timeframe) must be selected for tests. These are the data on which all tests will be made. A symbol available in the terminal or an external data file can be used for tests. History data files in *.FXT format to be stored in the /TESTER directory are used in tests. These files are created at tests automatically if the corresponding symbol available in the terminal was selected.
Symbol is defined in the "Symbol" field, and timeframe is in the "Period". If there is no data file for this symbol, period, and modeling method, it will be created automatically. If there are no history data for the symbol and period, the tester will download 512 latest history bars automatically.
Attention: If there are any data outside the latest 512 bars for a symbol, the data will be downloaded automatically up to the last available bar. This can cause sharp increase of incoming traffic. |
Modeling methods #
History data are saved in the terminal only as bars and represent records appearing as TOHLCV (HST format). These data can be used for modeling of price changes at testing experts. In some cases, such information is not enough for testing. For example, for the daily timeframe, price changes within a bar can result in triggering of the expert. At the same time, no triggering can occur at testing. In other words, testing an expert based on only bars can be inaccurate and give a false idea about the expert efficiency.
Terminal allows to test experts by various methods of history data modeling. Using history data from smaller periods, it is possible to see price fluctuations within bars, i.e., price changes will be emulated more precisely. For example, when an expert is tested on one-hour data, price changes for a bar can be modeled on one-minute data. Thus, modeling brings history data near the real price fluctuations and makes expert testing more authentic.
One of three history data modeling methods can be chosen for testing:
- Open prices only (fastest method to analyze the bar just completed)
Some mechanical trading systems do not depend on properties of modeling within a bar, they trade on completed bars. The bar is completed if the next one has appeared. These are such experts for which this modeling method was developed.
In this mode, the bar opening is modeled first (Open = High = Low = Close, Volume=1) what allows the expert to identify the completion of the preceding bar precisely. It is this incipient bar that is used to start testing the expert. At the next step, the fully completed current bar will be given, but no testing is performed on it! - Control points (based on the nearest less timeframe with fractal interpolation of 12 control points)
The control points modeling method is intended for a crude estimate of experts efficiency that trade within the bar. The history data of the nearest less timeframe must be available to apply this method. In the most cases, the available data of the less timeframe do not completely cover the time range of the timeframe under test. If the data of the less timeframe are missing, the further bar development will be generated on close prices of 12 preceding bars. It means that the changes within the bar are the same as those of price within the last 12 periods. It is fractal interpolation.
As soon as history data of the less timeframe appear, fractal interpolation will be applied to these new data. But there will be used not 12, but just 6 preceding bars. It means that really existing Open, High, Low, Close prices are reproduced, and two generated prices more. Values and locations of these two generated prices depend on that on 6 preceding bars. - Every tick (based on all available least timeframes with fractal interpolation of every tick)
This is the most accurate method of modeling prices within a bar. Unlike that of "control points", this method uses for generation not only data of the nearest less timeframe, but also those of all available nearest timeframes. At that, if there are data of more than one period for the same timeframe at the same time, the data of the least timeframe will be used for modeling. Like in the preceding method, control points are generated by fractal interpolation. It is also used for modeling of price changes between control points. It is possible that several similar ticks are modeled one after another. In this case, the doubled quotes will be filtered out, and the volume of the last of them will be fixed.
One has to consider the possible large amount of tick data modeled. This can influence the consumed resources of the operation system and testing speed.
Attention:
|
The price history stored in the client terminal includes only Bid prices. On default, to model Ask prices, the strategy tester uses the current spread of a symbol at the beginning of testing. However a user can set a custom spread for optimization in the "Spread" field.
Time Range #
The range of dates allows to test experts not on all available data, but within a certain time space only. This can be useful if there is a need to test a certain part of history data. Date range can be used not only for expert testing, but also for modeling of the testing succession of bars (file of data modeled to be used for testing). It is often no need to model data of the entire history, especially for every-tick modeling where the amount of unused data can be very large. That is why, if data range was allowed to be set at the initial modeling of testing succession, bars that are beyond this range will not be modeled, but just transcribed into the output succession. The data will not be excluded from the succession in order the correct calculation of indicators on the entire received history to be possible. It must be noted that the first 100 bars will not be modeled either. This limitation does not depend on the date range defined.
To enable date range limitation, one has to flag "Use date" and specify the necessary values in the fields of "From" and "To". After all settings have been made, one can press the "Start" button and start testing. After testing has started, the approximate time of completing of this process can be viewed in the lower part of the window.
Attention:
|