Aide MetaTrader 4
Charts
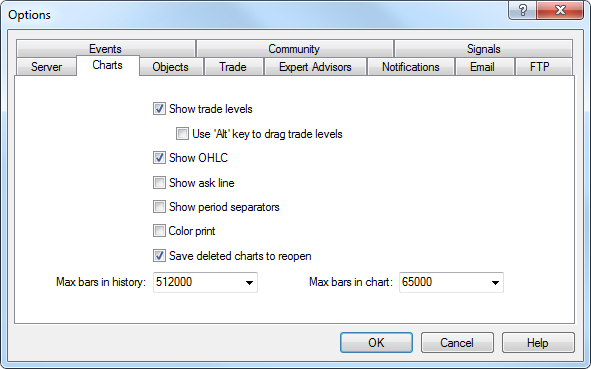
Charts show the dynamics of symbol price changes. Charts settings and history data parameters are grouped in this tab.

Changing of parameters in this tab will not cause any global changes in operation of the terminal.
- Show trade Levels
Lines of open and pending orders placed directly in the chart visualize where exactly the position was opened, when the pending order, Stop Loss or Take Profit will trigger. This option saves traders' work and helps to avoid some mistakes caused by human emotions. For it to be enabled, the "Show trade levels" must be checked, and the "OK" button must be pressed. At that, the lines corresponding with open prices of positions and orders will appear in the chart. Of course, if no order or position are opened, no levels will be shown in the chart. This option is active for open positions or orders only. No closed position will come within its action.
- Use "Alt" Key to Drag Trade Levels
This option is implemented for convenience of managing pending orders and stop levels on a chart. On default, with this option disabled, the orders and stop levels are moved using a mouse (drag'n'drop). In case many objects are attached to a chart, you can accidentally move one of them instead of a trade level. In this case, enable this option. After that, you'll still be able to move the trade levels using a mouse, but you'll need to hold the "Alt" key for that.
- Show OHLC
Charts show the price dynamics, but it is often very difficult to determine exact parameters of the bar by eye. The "Show OHLC" option is very helpful in such situations. It places an additional information line in the upper left corner of each chart. Here, besides the symbol name and chart period, prices of the last bar are listed. They are formatted as follows: OPEN, HIGH, LOW and CLOSE (OHLC) – open price of the bar, the highest price of the bar, the lowest price of the bar, and close price of the bar, respectively. Thus, the exact value of the last bar can always be seen. - Show ask line
Bars in the terminal are built and shown only for Bid prices. However, for opening of long positions and closing of short ones, Ask price is always used. But it is not shown in the chart in any way, it cannot be seen. To control over one's trading activities more attentively, one can enable the "Show Ask line" parameter. After this command has been executed, an additional horizontal line corresponding with Ask price of the last bar will appear in the chart. - Show period separators
Date and time of each bar are shown on the chart horizontal axis. The chosen timeframe is the value of this horizontal scale. The "Show period separators" option draws additional vertical lines in the chart that correspond with a larger timeframe. So, for charts having timeframe from M1 to H1, daily separators are built, for H4 – weekly, for D1 – monthly, and for W1 and MN1 – yearly ones. - Color print
Terminal allows to print not only black-and-white, but also colored charts. The latter ones are more appropriate for analysis than black-and-white ones. This option can be enabled by setting of the "Color print" checkbox and then pressing the "OK" button. After that, if the printer allows it, all charts will be printed in color. - Save deleted charts to reopen
Terminal allows to restore charts deleted from the workspace. If the "Save deleted charts to reopen" option is enabled, at deleting of a chart, its template will be saved in the /DELETED directory. Later on, any deleted chart can be restored with the "File – Open deleted" menu command. For example, it is possible to restore the four-hour chart of EURUSD after it has been deleted. The restored chart will also be a four-hour one, and all its settings with imposed objects (indicators, line studies) will be restored, as well. - Max bars in history and in charts
Bars stored in history and those shown in charts differ from each other. This difference is determined by the fact that any amount of bars can be kept in the hard disk provided that it has enough space. But the amount of bars shown in the chart is limited by the computer resources. To calculate values of technical and custom indicators, bars shown in the chart are used, as well. When a great amount of indicators and data to be shown are used simultaneously, computer free resources (central processor load and free RAM) can exhaust very soon. To avoid such problems, one can specify the amount of data shown in the charts independently. To do so, one must choose the suitable value from the pop-up list or enter it manually in the "Max bars in chart" field. The amount of bars to be stored in the hard disk is specified in the "Max bars in history" field. In future, this value will be used for testing expert advisors. Any amount of bars can be specified here.
Attention:
|