- Accelerator/Decelerator Oscillator
- Accumulation/Distribution
- Alligator
- Average Directional Movement Index
- Average True Range
- Awesome Oscillator
- Bears Power
- Bollinger Bands
- Bulls Power
- Commodity Channel Index
- DeMarker
- Envelopes
- Force Index
- Fractals
- Gator Oscillator
- Ichimoku Kinko Hyo
- Market Facilitation Index
- Momentum
- Money Flow Index
- Moving Average
- Moving Average Convergence/Divergence
- Moving Average of Oscillator
- On Balance Volume
- Parabolic SAR
- Relative Strength Index
- Relative Vigor Index
- Standard Deviation
- Stochastic Oscillator
- Williams' Percent Range
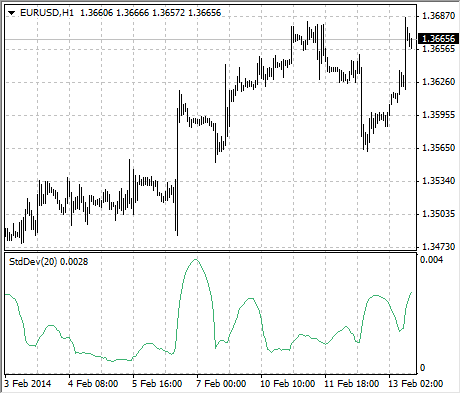
Standard Deviation
Standard Deviation – value of the market volatility measurement. This indicator describes the range of price fluctuations relative to simple moving average. So, if the value of this indicator is high, the market is volatile, and prices of bars are rather spread relative to the moving average. If the indicator value is low, the market can described as having a low volatility, and prices of bars are rather close to the moving average.
Normally, this indicator is used as a constituent of other indicators. Thus, when calculating Bollinger Bands®, one has to add the symbol standard deviation value to its moving average.
The market behavior represents the interchange of high trading activity and languid market. So, the indicator can be interpreted easily:
- if its value is too low, i.e., the market is absolutely inactive, it makes sense to expect a spike soon;
- otherwise, if it is extremely high, it most probably means that activity will decline soon.
Calculation
StdDev = SQRT (SUM ((CLOSE - SMA (CLOSE, N))^2, N)/N)
Where:
SQRT – square root;
SUM (..., N) – sum within N periods;
SMA (..., N) – simple moving average having the period of N;
N – calculation period.