- Setup
- Results
Results
After optimization has been completed, its results can be viewed in the tabs of "Optimization Results" and "Optimization Graph".
Optimization Results
Unlike testing, optimization is supposed to perform many passes of the mechanical trading system (MTS) with different inputs. This is aimed at determining of such expert parameters at which its efficiency will be the highest. To optimize an expert, one has to flag "Optimization" in the testing settings tab and press "Start". After that, two new tabs will appear in the window: "Optimization Results" and "Optimization Graph".
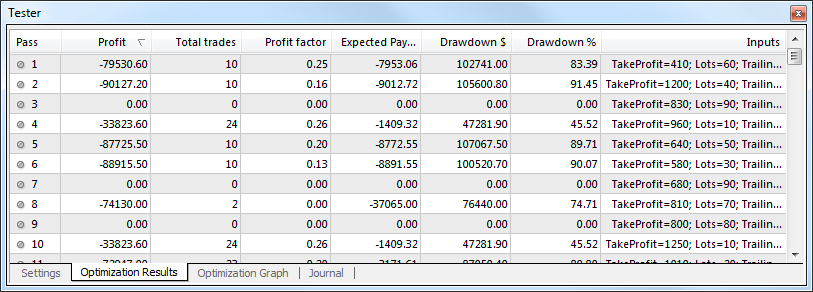
There are not all operations listed in the tab of "Optimization Results", unlike that of testing results, but only final reports about each pass. The entire information is represented as a table with the following fields:
- Pass – the pass number;
- Profit – the pure profit (gross profit minus gross loss);
- Total trades – the total amount of open trade positions;
- Profit factor – ratio between gross profit and gross loss in per cents. One means that these values are equal;
- Expected payoff – mathematical expectation of win. This value to be calculated statistically represents the average profit/loss factor of one trade. It can also be considered to represent the expected profit/loss factor of the next trade;
- Drawdown $ – the largest drawdown related to the initial deposit, in the deposit currency;
- Drawdown % – the largest drawdown related to the initial deposit, in per cents;
- Inputs – changeable values of inputs at each pass.
Having clicked with the left mouse button on any column header, one can sort out all records in the table in increasing or decreasing order. At execution of the "Set Input Parameters" context menu command, the data of the selected pass will be written as the expert basic inputs (expert properties window, "Inputs" tab). At that, it will be switched to the "Settings" tab, and the optimization will be disabled. Having pressed the "Start" button, one can start to test the expert with the selected inputs. Double click with the left mouse button on the pass line in the Optimization Results tab allows to do the same. Using the "Copy" context menu command or accelerating keys of Ctrl+C, one can copy the selected results lines to the clipboard for further use in other applications. If no line has been selected, the entire table will be copied to the clipboard. To do the same, one can also execute the "Copy All" command. The report about optimization results can be saved on the hard disk as an HTML file. To do so, one has to execute the "Copy As Report" context menu command. Other context menu commands allow to set up representation of results:
- Skip Useless Results – show/hide the results of unprofitable passes;
- Show Input Parameters – show/hide the "Inputs" column;
- Auto Arrange – arrange the column sizes automatically when the window size has been changed.
The same action can be done by pressing of A; - Grid – show/hide grid to separate the columns.
The same actions can be done by pressing of G.
Optimization Graph
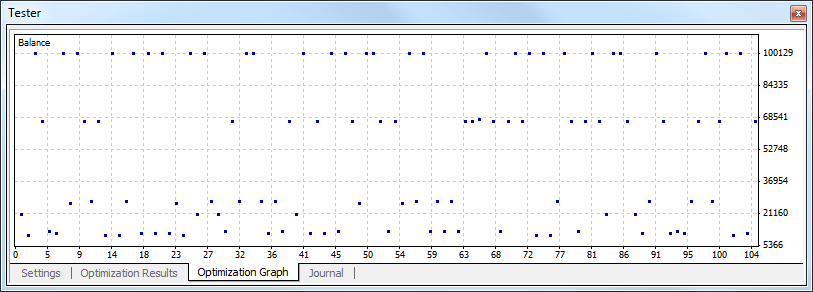
The graph of profit of all passes is drawn automatically in the "Optimization Graph" tab. The graph allows to estimate the profitability of the use of different inputs combinations visually. The graph representing the amount of profitable (green color) and unprofitable (red color) trades at each pass is given in the bottom of the window, as well.
Double click with the left mouse button on any point of the graph switches to the "Optimization Results" tab and selects the corresponding pass. Using the "Copy" context menu command or accelerating keys of Ctrl+C, one can copy the graph to the clipboard to be used in other applications. The graph can also be stored on the hard disk as a GIF file. To do so, one has to execute the "Save as Picture" context menu command or press accelerating keys of Ctrl+S.