Report
The summarized results of experts testing and some key indices are represented in the "Report" tab.
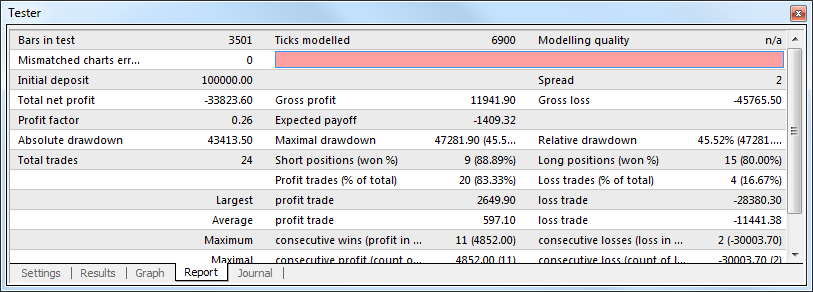
Such reports allow to compare different experts to each other in a quick mode. The following data are published in reports:
- Bars in test – the amount of the modeled history data in bars;
- Ticks modeled – the amount of the modeled ticks;
- Modeling quality – the quality of ticks modeled during testing in per cents. Modeling is schematically displayed as a band in the next line of the report. This band can be of one of three colors:
- Grey – this part of the data available was not tested at all. Grey color can appear, if the range of dates was given in tester settings;
- Red – modeling was not performed within this subrange since no data of a smaller period were available. At that, only data from the period selected in the tester settings were used;
- Green – modeling was performed within this subrange. At that, the brighter the color is, the better in quality the modeling was. For example, when testing at the period of H1, the dark-green band can mean that M30-period data were used for testing, and the brightest means that those of M1 period were used;
Attention: If the fastest method ("by open prices") has been used for modeling in testing settings, the entire band will be red. At that, "n/a" – modeling has not been performed at all – will be written in the "Modelling quality" field; |
- Initial deposit – the volume of the initial deposit;
- Total net profit – financial result of all trades. This index represents a difference between the "Gross profit" and "Gross loss";
- Gross profit – the sum of all profitable trades in terms of money;
- Gross loss – the sum of all unprofitable trades in terms of money;
- Profit factor – the ratio between gross profit and gross loss in per cents. The one value means that profit equals to loss;
- Expected payoff – the expected payoff. This statistically calculated index represents the average profit/loss factor of a trade. It can also be considered for representing the expected profit/loss factor of the next trade;
- Absolute drawdown – the largest loss is lower than the initial deposit value;
- Maximal drawdown (%) – maximal loss of the local maximum in the deposit currency and in percents of the deposit;
- Relative Drawdown – the maximal loss in percents of the maximum equity value and its corresponding money value;
- Total trades – the total amount of trade positions;
- Short positions (won %) – the amount of short positions and percentage of won thereof;
- Long positions (won %) – the amount of long positions and percentage of won thereof;
- Profit trades (% of total) – the amount of profitable trade positions and their percentage in the total trades;
- Loss trades (% of total) – the amount of loss trade positions and their percentage in the total trades;
- Largest profit trade – the largest profit among all profitable positions;
- Largest loss trade – the largest loss among all unprofitable positions;
- Average profit trade – average profit value for a trade (the sum of profits divided by the amount of profitable trades);
- Average loss trade – average loss value for a trade (the sum of losses divided by the amount of unprofitable trades);
- Maximum consecutive wins (profit in money) – the longest series of profitable trade positions and the sum of their wins;
- Maximum consecutive losses (loss in money) – the longest series of unprofitable trade positions and the sum of their losses;
- Maximal consecutive profit (count of wins) – the maximum profit of a series of profitable trades and the amount of profitable trades corresponding with it;
- Maximal consecutive loss (count of losses) – the maximum loss of a series of unprofitable trades and the amount of unprofitable trades corresponding with it;
- Average consecutive wins – the average amount of profitable positions in consecutive profitable series;
- Average consecutive losses – the average amount of unprofitable positions in consecutive unprofitable series.
This report can be copied to the clipboard or saved in the hard disk as an HTML file. To do so, one has to execute the "Copy" context menu command or that of "Save as Report", respectively. The report can also be copied to the clipboard by pressing of accelerating keys of Ctrl+C.
More details are given in the sections of "testing Expert Advisors" and "Optimization".