Graphical Objects
Graphical objects are objects in the terminal that are imposed manually into the chart. These objects are used for analytical purposes. They include:
- Line Studies – lines and various geometrical shapes to be imposed into the price or indicators charts. They include support/resistance lines, trendlines, as well as Fibonacci, Gann, Andrews' tools, etc. More details about line studies can be found in the section of the same name;
- Shapes – geometrical shapes (rectangle, triangle, and ellipse) that allow to mark various areas in the price chart;
- Arrows – arrows and signs that allow to mark the most significant points in the chart;
- Text – text intended for adding of comments to the chart;
- Text Label – text intended for adding of comments and anchored to the chart window coordinates. Text label does not move when the chart is scrolled.
All objects are grouped in the "Insert" menu and in the "Line Studies" toolbar. Having selected an object in the list and set a point in the chart (or in an indicator window), one can impose the tool.
Attention: To impose several objects, one has to set more than one point. The object will not appear in the chart until all necessary points are set. |
After the object has been created, it can be moved or modified. To do so, one has to select the object first. If the "Select object by single mouse click" parameter is set in terminal settings, one has to click once with the left mouse button on any element of the object. If not, the double-click should be used. The object can be considered as selected if square markers or frames appear. The markers are intended for moving of objects and changing their drawing parameters. Thus, for example, to change the Fibonacci Fan location, one has to hold its central marker with the left mouse button and move the cursor. And moving of any of the extreme markers will result in changing of the object drawing parameters. Terminal allows to create copies of various object very fast. To do so, one has to select the object and, holding Ctrl pressed, move it with the central marker.
All objects imposed into the chart become unnecessary sooner or later, and they can be removed by commands of the context menu. Besides, the Backspace key allows to remove objects in series. In future, all removed objects can be restored. To do so, it is necessary to execute the "Undo Delete" command of the object context menu, the "Charts – Objects – Undo Delete" menu command, or use accelerating keys of Ctrl+Z.
Object Properties
Every object has its specific properties. Properties can differ depending on the object. To manage the properties of an object, one has to select the object and execute its context menu command of "Properties...", the "Charts – Objects – Objects List" menu command. After that, the window of the object name will appear that contains several tabs. General object settings are placed in the "Common" tab.
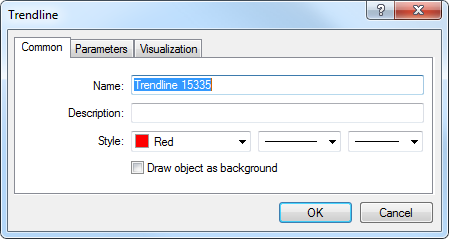
The following is available here:
- Name – the object unique name within one chart that is set for the object automatically. It can be changed if another name is entered in this field. Such names make it easy to mark the object out among many others of the same type;
- Description – description/text contents of the object that also serve for marking it out among many others of the same type. Besides, these descriptions can be shown in the chart if the "Show object descriptions" option is enabled in the chart settings;
- Style – object lines style. Color, forms and thickness of lines can be chosen here;
- Draw object as background – draw object in the background, behind the chart. Being enabled, this option provides filling of the objects like shapes or channels (excluding Fibonacci Channel) with color.
Coordinates of the object control points in the chart can be changed in the "Parameters" tab. Time coordinates of the object control points should be entered in the "Time" fields, and coordinates of anchoring to vertical axis of a chart of indicator should be given in the "Value" fields. An object can have from one to three coordinates.
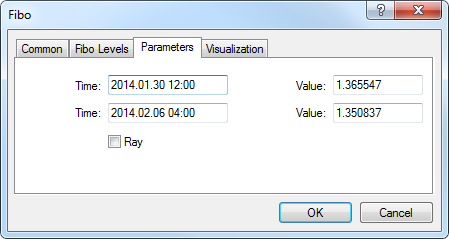
For some objects, additional options are used in the "Parameters" tab:
- Angle in degrees – angle of the object slope anticlockwise in degrees;
- Scale – ratio between units of vertical (pips) and horizontal (bars) axes of the object. Normally, the number of pixels in a unit of the horizontal axis (time) differs from that of the vertical axis (prices) when chart are drawn. One-to-one scale brings them to the same value. For certain objects, changing of this parameter changes the ratio;
- Arrow code – object code;
- Ray – show the object trendlines as rays;
- Anchor – one of the chart corners at which the text label is anchored;
- X-distance – horizontal distance between the anchor corner of the window and the text label in pixels;
- Y-distance – vertical distance between the anchor corner of the window and the text label in pixels.
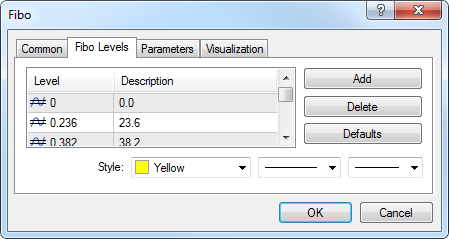
The object visualization mode for different timeframes can be changed in the "Visualization" tab. The object will then be shown only for the selected timeframes. This can be useful when the tool has different settings for different timeframes. The "Fibo Levels" tab is specifically used only for Fibonacci tools. The list of the tool levels is given here in form of a table. The values of the levels can be changed or deleted (the "Delete" button). A new level can be added by pressing of the "Add" button. At that, if "(%$)" is entered in the "Description" field, the price value corresponding with this level will be shown in the chart. The "Defaults" button resets the initial values. The "Style" field that allows to set up the color, appearance, and thickness of levels of the object is located in the lower part of the tab.