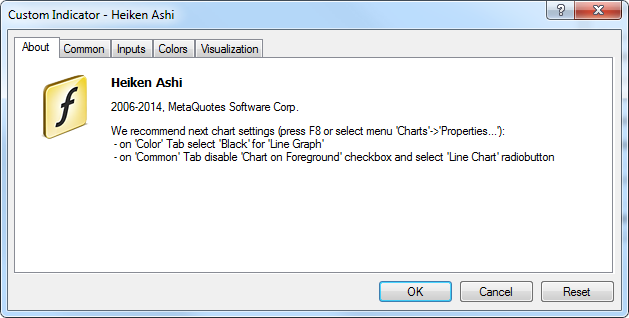
Attaching to Chart
After general setup has been completed, one can attach custom indicators to the chart. A custom indicator can be imposed into the active chart by a double click with the left mouse button on it in the "Navigator – Custom Indicators" window or by execution of the context menu command "Attach to a chart". The "Drag'n'Drop" technique allows to impose the analytical tool into any chart. At that, the setup window will appear automatically that has several tabs:
- Common
Import from DLLs and MQL4 can be managed in the "Common" tab. Besides, if indicator is drawn in a separate window, one can set up its range from here. To do so, one has to flag the corresponding options and set the desired values in the fields.
- Allow DLL imports – enable/disable imports of functions from DLL files;
- Allow import of external experts – enable/disable calling of functions from external experts;
- Allow modification of Signals settings – this option allows/prohibits an MQL4 application subscribing and unsubscribing from Signals as well as changing the settings of signal copying. The functions for working with the base of Signals from an MQL4 application allow performing your own analysis of the quality of signals, dynamically manage the subscription and adjust risks. More detailed information about the functions for managing the signals is provided in MQL4 Reference.
- Inputs
External variables that can be managed directly from the terminal are grouped in the "Inputs" tab. To modify the desired variable, one has to double-click on its value in the table and write a new one. - Colors
The "Colors" tab is intended for managing the indicator elements to be shown in the screen. Besides colors, one can also modify thickness and style of lines. - Levels
Horizontal lines at any level can be set from the "Levels" tab in the indicator window. To create a new level, one has to press the "Add" button, and to delete it, one has to press the "Delete" button. Colors, thickness and style of levels can also be changed from this tab.
Attention: This tab is not available for indicators drawn directly in the price chart. |
- Visualization
One can limit the use of an indicator by timeframes in the "Visualization" tab. This can be useful if the same indicator must have different settings for different timeframes. One can, for example, impose two copies of the same indicator with different settings into the same chart and limit their use by timeframes: the first indicator will work only for smaller timeframes, and the second one will do for larger timeframes. The "Show in the Data Window" option allows to hide/show data about the given indicator in the Data Window.
Immediately after that, recalculation if the indicator values and drawing thereof in the chart will start. Custom indicators, like technical ones, can be drawn in a separate indicator window with its own vertical scale (for example, MACD) or imposed directly into the price chart (for example, Moving Average).