- Setup
- Properties
- Results
- Graph
- Report
- Journal
- Optimization Results
- Optimization Graph
Optimization Graph
Unlike testing, optimization is supposed to use many repeated passes of mechanical trading system (MTS) with different input parameters. This is performed to determine such expert parameters at which its profitability is the highest. To perform optimization, one has to flag the field of the same name in the Settings tab and press the "Start" button. After that, two new tabs, "Optimization Results" and "Optimization Graph", will appear in the window.
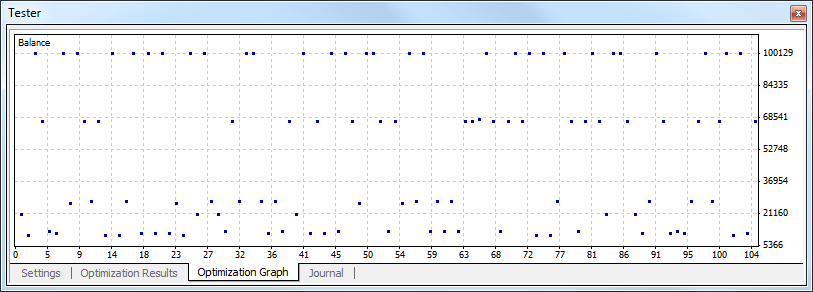
The profit graph of all passes will be drawn automatically in the "Optimization Graph" tab. The graph allows to estimate and visualize the profitability of us of different combinations of inputs. A chart representing the amount of profit (green) and loss (red) trades of each pass is given in the lower part of the graph, as well.
Double click with the left mouse button on any point of the graph switches to the "Results" tab and selects the corresponding pass. Using the "Copy" context menu command or accelerating keys of Ctrl+C, one can copy the graph to the clipboard for further use in other applications. The graph can also be stored as a GIF file on the hard disk. To do so, one has to execute the "Save as Picture" context menu command or press accelerating keys of Ctrl+S. You can enable or disable displaying the grid on the chart using the corresponding context menu command.
More details can be found in the sections of "testing Expert Advisors" and "Optimization".