Graph
In the "Graph" tab, the graphs of the account balance (blue line – "Balance") and general account status considering open positions (green line – "Lots") are drawn automatically.
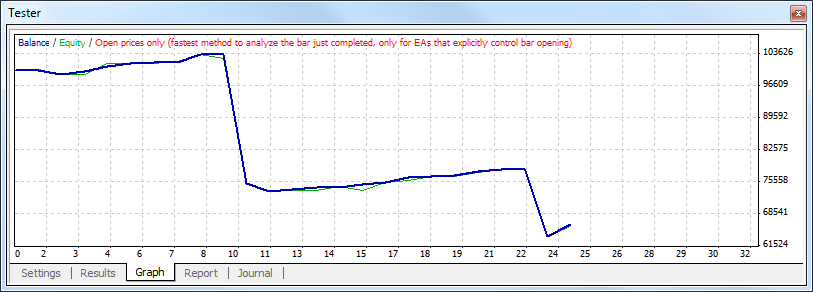
If only balance line is shown in the graph, it means that "Balance" and "Lots" lines coincide during the whole testing process. The graph allows to watch the trade results more pictorially when testing. If the lot sizes have been changed during testing, the bar chart showing these changes will appear in the lower part of the graph.
Double click with the left mouse button on any point of the graph will switch to the "Results" tab and select the corresponding line. Using the "Copy" context menu command or accelerating keys of Ctrl+C, one can copy the graph to the clipboard for further use in other applications. The graph can also be stored as a GIF file on the hard disk. To do so, one has to execute the "Save as Picture" context menu command or press the accelerating keys of Ctrl+S. The "Set Date "From"" and "Set Date "To"" commands allow to set the time range of testing. At that, the dates of operations selected are written in the fields of "Use Date From:" and "Use Date To:" in the Settings tab. This is useful if there is a need to test an expert or to optimize its parameters for this given time range.
More details are given in the sections of "testing Expert Advisors" and "Optimization".