Working with Charts
A chart shows the price changes for a security with the time. Charts are necessary for performing technical analysis, working of expert advisors and testing thereof. Up to ninety-nine charts can be opened in the terminal at the same time.
The client terminal allows to:
- open up to 99 chart simultaneously;
- set up their representation form and information shown;
- print charts;
- impose and delete various objects and indicators;
- recover deleted charts;
- use chart templates.
New trading features
The new generation platform has two times more timeframes (21 vs 9), as well as the precise time scale. Now graphical objects are not necessarily linked to bars. Object anchors can be placed in any position between the chart bars. Moreover, when switching between timeframes, the accurate positioning of the control points of the object is preserved. New built-in indicators and analytical tools have also been added.
In the new terminal, all timeframes are built based on minute bars, while the history is downloaded and synchronized automatically without the need for manual download. Additionally, the trade server stores the tick history of each symbol, so that you can use it for testing on real ticks. This ensures the maximum accuracy of testing trading robots on history and allows you to avoid mistakes when using rough tick generation methods.
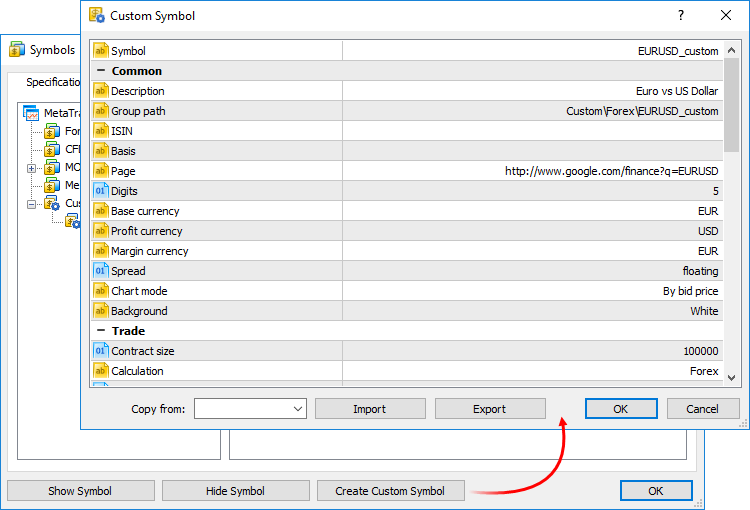
The new platform also features custom symbols, or synthetic indices you can create yourself. To do that, simply enter the calculation formula or download files with minute bars or tick history. You can test your strategies both on custom symbols, and the ones provided by the trade server. Thus, the new terminal allows you to test your trading ideas on an unlimited set of symbols and markets.