- Accelerator/Decelerator Oscillator
- Accumulation/Distribution
- Alligator
- Average Directional Movement Index
- Average True Range
- Awesome Oscillator
- Bears Power
- Bollinger Bands
- Bulls Power
- Commodity Channel Index
- DeMarker
- Envelopes
- Force Index
- Fractals
- Gator Oscillator
- Ichimoku Kinko Hyo
- Market Facilitation Index
- Momentum
- Money Flow Index
- Moving Average
- Moving Average Convergence/Divergence
- Moving Average of Oscillator
- On Balance Volume
- Parabolic SAR
- Relative Strength Index
- Relative Vigor Index
- Standard Deviation
- Stochastic Oscillator
- Williams' Percent Range
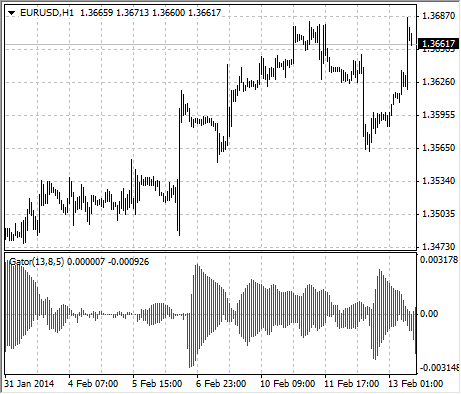
Gator Oscillator
Gator Oscillator is based on the Alligator and shows the degree of convergence/divergence of the Balance Lines (Smoothed Moving Averages). The top bar chart is the absolute difference between the values of the blue and the red lines. The bottom bar chart is the absolute difference between the values of the red line and the green line, but with the minus sign, as the bar chart is drawn top-down.
Calculation
MEDIAN PRICE = (HIGH + LOW) / 2
ALLIGATORS JAW = SMMA (MEDIAN PRICE, 13, 8)
ALLIGATORS TEETH = SMMA (MEDIAN PRICE, 8, 5)
ALLIGATORS LIPS = SMMA (MEDIAN PRICE, 5, 3)
Where:
MEDIAN PRICE – median price;
HIGH – maximum price;
LOW – minimum price;
SMMA (A, B, C) – smoothed moving average. Parameter À – smoothed data, Â – smoothing period, Ñ – shift to future. For example, SMMA (MEDIAN PRICE, 5, 3) means that the smoothed moving average is taken from the median price, while the smoothing period is equal to 5 bars, and the shift is equal to 3 bars;
ALLIGATORS JAW – the blue line;
ALLIGATORS TEETH – the green line;
ALLIGATORS LIPS – the red line.