MetaTrader 4のヘルプ
Charts
Commands managing the chart and technical indicators imposed in it are collected in the "Charts" menu.
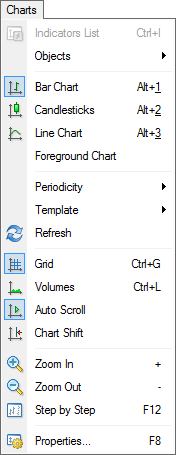
The following commands are available in this menu:
- Indicators List – call window managing indicators imposed in the active chart. The full list of indicators imposed (including Custom Indicators) is given in the window appeared. Having selected an indicator, one can change its settings or remove it from the chart.
The same action can be performed by the chart context menu command of the same name or by accelerating keys of Ctrl+I; - Objects – call sub-menu managing imposed objects. The following commands are available in the sub-menu:
- Objects List – call window managing the imposed objects. Objects include line studies, signs, shapes, and texts. The selected object can be modified (the "Edit" button) or deleted by pressing of the button of the same name in this window. Besides, the "Show" command moves the active chart to the imposed object location;
- Delete Last – delete the last imposed object from the chart.
The same action can be performed by pressing the Backspace button; - Delete All Selected – delete all selected objects from the chart window.
The same action can be performed by pressing the Delete button; - Delete All Arrows – delete all objects from the chart window;
- Unselect All – unselect all the objects imposed in the chart;
- Undo Delete – return the deleted object back into the chart.
The same action can be performed by accelerating keys of Ctrl+Z;
- Bar Chart – display the chart as a sequence of bars.
Execution of this command is the same as pressing of the button of the "Charts" toolbar or accelerating keys of Alt+1;
 - Candlesticks – display the chart as a sequence of "candlesticks".
Execution of this command is the same as pressing of the button of the "Charts" toolbar or accelerating keys of Alt+2;
 - Line Chart – display the chart as a broken line connecting close prices of bars.
Execution of this command is the same as pressing of the button of the "Charts" toolbar or accelerating keys of Alt+3;
 - Foreground Chart – put the chart as a "foreground". If this function is enabled, all analytical objects (technical indicators and graphical objects) will be placed "behind the chart", not over it;
- Timeframes – choose the chart timeframe. After this command has been executed, a sub-menu will appear where the active chart timeframe can be selected.
The chart timeframe can also be changed with help of the "Timeframes" toolbar; - Template – call the template managing sub-menu. From this sub-menu, one can impose any template into the active chart. Moreover, a new template can be stored based on the active chart, or an existing one can be deleted. More details about working with templates can be found in the "Profiles and Templates" section.
The sub-menu managing templates can also be called by pressing of the button of the "Charts" toolbaror by the chart context menu command of the same name;
Attention: The DEFAULT template cannot be deleted. |
- Refresh – refresh history data. At that, all missing data within the existing history will be downloaded. The same action can be performed by the chart context menu command of the same name.
Attention: History outside the range of the existing data will not be added. |
- Grid – show/hide grid in the chart window.
The same actions can be performed by the chart context menu command of the same name and by pressing of the accelerating keys of Ctrl+G; - Volumes – show/hide volumes in the chart.
The same actions can be performed by the chart context menu command of the same name or by pressing of accelerating keys of Ctrl+L; - Auto Scroll – enable/disable automatic shifting of the chart to the left after a new bar has started to form. If this option is enabled, the last bar will always be shown in the chart.
Execution of this command is the same as pressing of the button of the "Charts" toolbar;
 - Chart Shift – shift the chart from the left window border to the shift label of the chart. The shift label of the chart (a grey triangle in the upper part of the window) can be moved with the mouse horizontally within 10 to 50% of the window size.
Execution of this command is the same as pressing of the button of the "Charts" toolbar;
 - Zoom In – zoom in the chart.
The same action can be performed by pressing of the "+" key or the button of the "Charts" toolbar, as well as by moving the cursor to the right, the left mouse button being pressed on the horizontal scale;
 - Zoom Out – zoom out the chart.
The same action can be performed by pressing of the "-" key or the button of the "Charts" toolbar, as well as by moving the cursor to the left, the left mouse button being pressed on the horizontal scale;
 - Step by Step – shift the chart by one bar to the left.
The same action can be performed by pressing of F12; - Properties... – setting up the chart parameters. At this command execution, the chart setup window will appear.
The same actions can be performed by the chart context menu command of the same name or by pressing of F8.
Attention: The most of the "Charts" menu commands are duplicated in the toolbar of the same name and in the chart context menu. |